The NBA prop board looks like a buffet and prices like a trap. Points, rebounds, assists, threes, turnovers, defensive stats, and combo markets all describe the same game through different mechanisms. Treating them as interchangeable overs and unders is the quickest way to pay for information you never modeled.
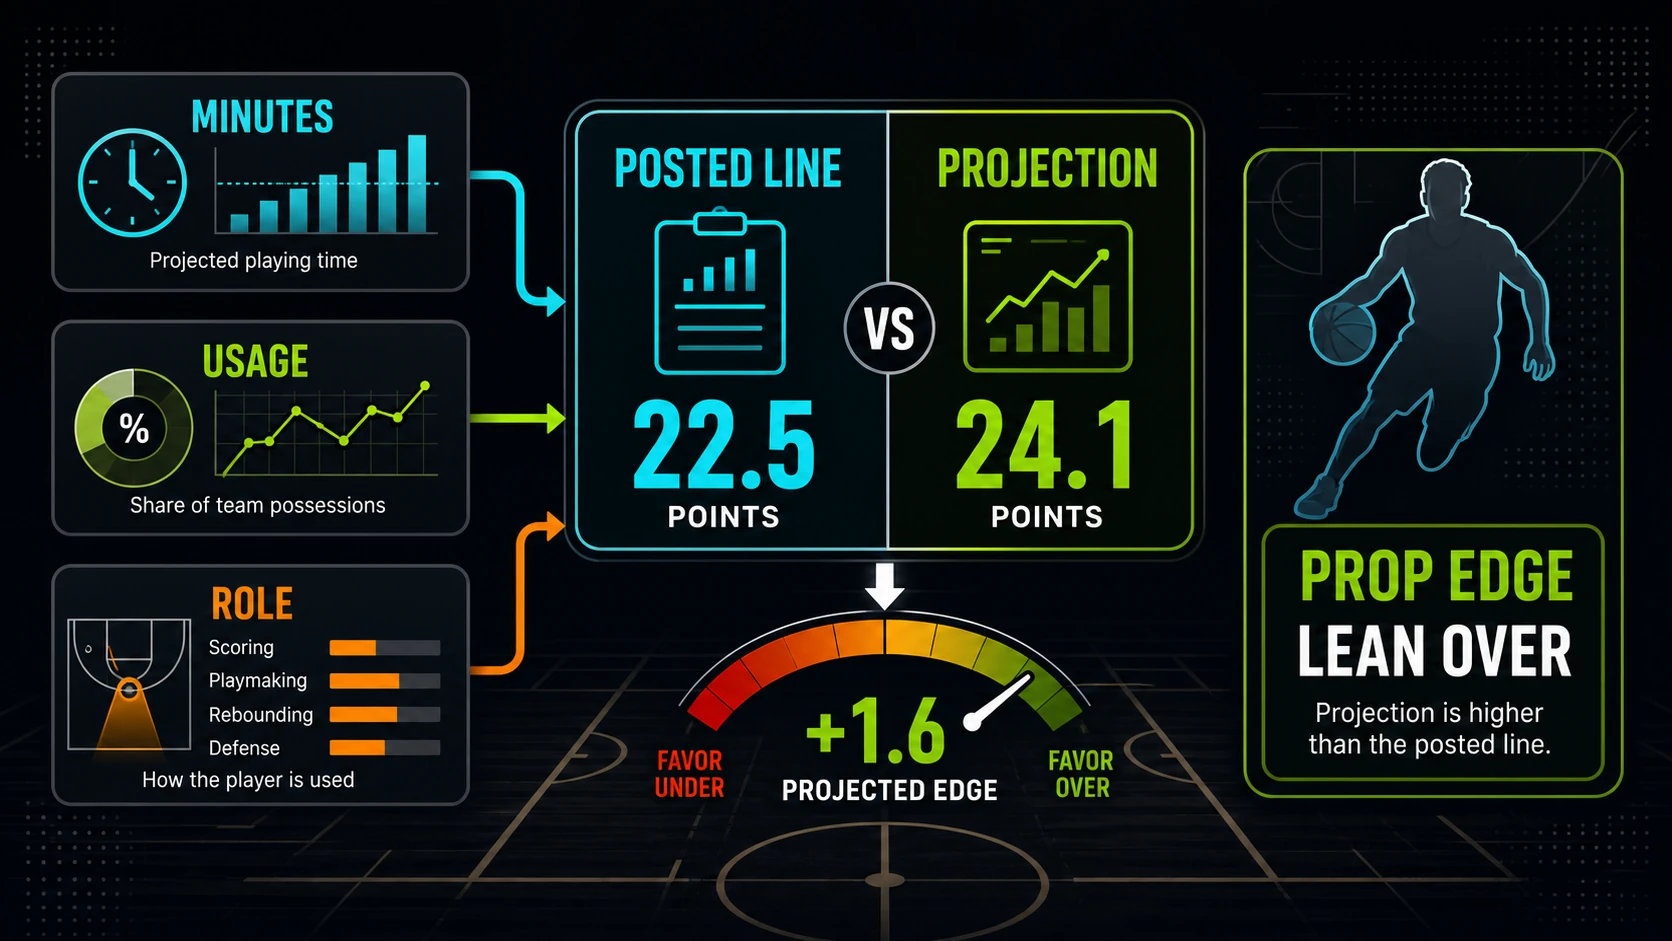
The clean approach to NBA player prop markets starts with minutes and role. Then it asks which opportunities create the stat, how volatile the conversion is, and whether the available line reflects the current lineup. Specialize by mechanism, not by whichever column is flashing green.
Minutes come before every counting stat
A player cannot score, rebound, or assist from the bench. Expected minutes should reflect starting status, closing role, rotation competition, foul risk, injury management, and game-state sensitivity. The starter label alone is not enough; some bench players close, and some starters lose the final shift.
Write the minutes assumption next to the projection. If the lineup is unresolved, use scenarios or pass. Small errors in playing time can overwhelm careful work on efficiency, especially for players with unstable roles.
Points props are volume plus shot quality
Points begin with shot attempts and free-throw opportunities, then pass through expected efficiency. Usage is useful, but it is not a complete projection. Two players can finish the same share of possessions through very different shot profiles, and defensive coverage can change which attempts are available.
Injury news matters because it can reassign creation and attention at the same time. A teammate's absence may bring more shots and harder coverage. Model both. A blunt usage bump that ignores shot location, ball-handling duty, and opponent response is only half an adjustment.
The registered scoring view below is descriptive history. It does not supply current minutes, roles, prices, or a prop edge.
Rebounds are an opportunity market
Rebound chances depend on missed shots, where those misses travel, the player's defensive assignment, and who else shares the floor. A center pulled away from the rim may have fewer chances even in a fast game. A wing can gain boards when a larger teammate sits or when the scheme asks everyone else to release in transition.
Use lineup and opponent shot-profile data when available. Team pace alone is not enough. More possessions can create more misses, but the player still needs position and minutes to collect them.
Assists depend on creation and conversion
An assist projection needs potential assists or comparable creation evidence, plus the expected shooters and finishers around the ball handler. A lead guard can keep the same time of possession while losing assists because a key scorer is out. Another can gain assists when the offense routes more actions through him.
Opponent coverage matters. Traps can force the ball out early and create secondary assists that never reach the primary handler's box score. Drop coverage can invite the ball handler to shoot instead of pass. Model the decision tree, not just the player's season average.
Threes are an attempt distribution first
Three-point makes are volatile because attempts and conversion both swing. The more stable question is whether the player will receive the expected volume and shot quality. Corner access, defensive help rules, transition chances, and the presence of other creators all shape the attempt distribution.
Recent makes are weak evidence without a change in attempts or shot quality. A hot streak can move public attention faster than it moves the underlying expectation. Do not confuse the result with the opportunity.
Combo props hide correlation
Points, rebounds, and assists can move together through minutes and game script, but they can also trade off through role. A player doing more creation may take fewer shots. A small lineup may raise scoring and lower rebound position. Simply adding separate means can understate the uncertainty in the combined result.
Build the joint distribution or at least inspect the shared assumptions. A combo market is useful when the role is broad and the exact stat path is uncertain. It is poor camouflage for three weak projections.
Alt markets change the question
Alternative lines move the threshold and the price, which changes the required win probability. The projection needs a distribution, not just a mean, to judge them. A player with a wide outcome range can have the same average as a steady player and a very different chance of clearing a distant threshold.
Do not treat a lower line as automatically safer or a higher line as automatically valuable. Compare the model probability with the no-vig market probability at the actual available price. When the distribution is poorly estimated, pass.
Injury and status timing must be reconstructable
Store the official status source, lineup confirmation, projection time, and market snapshot. A prop model cannot claim an edge using information that arrived after the captured line. If a market was suspended, note that there was no actionable price rather than preserving a stale one as if it could be bet.
The same standard applies to historical studies. Final box scores are easy to obtain; the hard part is knowing what was available before tip. A clean pregame dataset is worth more than a larger contaminated one.
Grade each market on its own terms
Track the threshold, price, closing threshold, closing price, projection, and result. Report graded win rates with the window and sample. Do not invent a universal price for props, and do not translate a mixed set of prices into a clean-looking return claim without the actual fills.
Specialization helps because each market fails differently. Points miss on role and efficiency. Rebounds miss on position and shot profile. Assists miss on teammate conversion and coverage. Threes miss noisily even when the attempt read is sound. Review the mechanism before rewriting the model.
The prop-board discipline
- Project minutes and closing role first.
- Build each stat from its own opportunity chain.
- Use distributions for volatile and alternate markets.
- Preserve status, projection, and price timestamps.
- Account for shared assumptions across related props.
- Pass when the role or available price cannot be verified.
The board offers many markets because uncertainty can be packaged many ways. Pick the statistic whose mechanism you understand best, demand a real price, and leave the rest alone.
Breakeven win rate at recorded American prices
Breakeven probability is calculated only from American prices that were actually captured in the odds-history table.