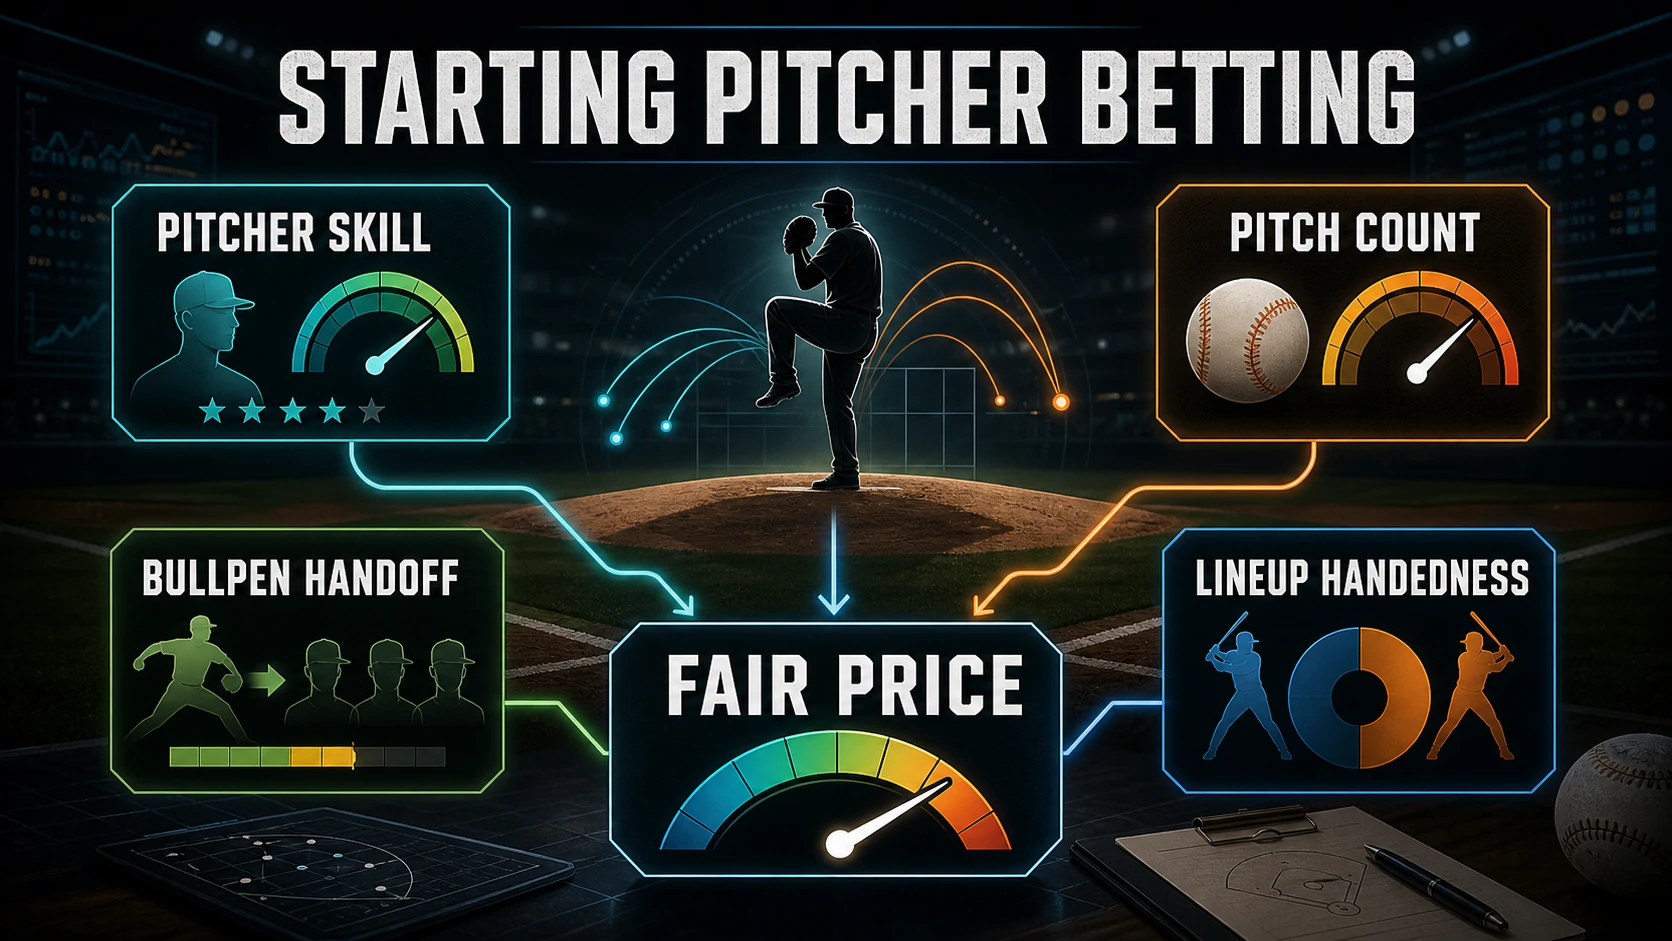
MLB starting pitcher betting starts with two estimates: how well the starter prevents runs and how many outs he is expected to cover. The lineup, park, and bullpen determine what those estimates mean for the total or moneyline.
The market prices the starter, the innings left for the bullpen, and the lineup facing both. Treat those pieces separately so the total can be audited; “ace day” is a story, not a number.
Start with workload, not reputation
A starter projection needs an innings distribution, not a fixed promise. The likely workload depends on recent pitch usage, role, health, game context, and the club’s alternatives. A pitcher expected to work deep changes two parts of the price at once: his own run allowance matters for longer, and fewer bullpen outs need to be covered. A shorter projection does the opposite.
That distinction is why two pitchers with similar rate statistics can produce different totals. One can be trusted for another trip through the lineup while the other hands the game to middle relief earlier. The rate is only half the forecast; the amount of exposure determines how much weight it receives.
Do not turn workload into a folklore rule. Extra rest, a high recent pitch count, and a skipped turn are empirical questions rather than automatic adjustments. Measure them in the same historical window and role definition used by the model. When the evidence is thin, widen the projection rather than pretending the schedule provides a free side.
ERA is a receipt, not a diagnosis
ERA tells you how many earned runs were charged. It does not tell you which parts came from strikeouts, walks, home runs, batted-ball quality, defense, sequencing, park, or inherited runners. Those mechanisms carry different amounts of predictive value.
Fielding-independent estimators reorganize the evidence around events a pitcher influences more directly, but they are not magic truth. A projection still has to account for contact quality, pitch mix, velocity, location, opponent, and the environment in which the numbers were recorded. Replacing one public statistic with another does not explain the pitcher; the goal is to measure the components that matter.
Pitch-mix changes deserve attention because a season line can hide a different current pitcher. A new pitch, a usage shift, or a velocity change can alter the matchup before the aggregate catches up. Verify persistence, then test whether the change improves the outcomes that matter; one unusual start is a note, while a stable change becomes an input worth testing.
Price the lineup the pitcher will actually face
A pitcher does not face “league average.” He faces a batting order with a particular handedness mix, contact profile, patience level, and likely bench plan. Start with the confirmed lineup. Then ask how the pitcher’s repertoire interacts with those hitters.
Handedness is an entry point, not the verdict. A same-handed matchup can still favor the hitter if the pitch mix lands in his strength. An opposite-handed matchup can still favor the pitcher if his changeup or command closes the expected platoon gap. Use batter-versus-pitch-type and pitcher-versus-handedness information as conditional inputs, with enough shrinkage to keep small samples from running the model.
Park and weather belong in the same pass, but only once. If the upstream projection is already park adjusted, do not apply another park multiplier at the end. The clean workflow documents where each adjustment enters, so a strong pitching matchup cannot be counted twice under two different labels.
The bullpen handoff is part of the starter price
Every full-game starter opinion eventually becomes a bullpen opinion. Project when the handoff is likely, which relievers are plausibly available, and how their matchups differ from the starter’s. A great first segment can still be paired with a fragile second segment. A modest starter can be protected by a deep relief plan.
Openers and bullpen games require a sequence instead of a single-pitcher shortcut: opener, bulk arm, high-impact relievers, and fallback options. Weight each by probable workload. When the announced plan is vague, demand a better price or pass rather than hiding the uncertainty.
The chart above comes from the registered 2024 Statcast sample and groups recorded RBI by pitcher. Read it as descriptive sample volume. A high total can reflect opportunity as much as effectiveness, so it cannot replace rate, workload, and context. That is precisely the trap a starter model should avoid.
Choose the market that matches the case
A first-five bet narrows the settlement window and reduces dependence on late relief, but an early exit can still bring the bullpen into the window. The first-five guide fits when the case is concentrated in the opening segment.
A full-game total needs the complete pitching plan, while a moneyline also needs the opposing staff and both offenses; a run line adds the margin distribution. Do not migrate a good starter read into whichever payout looks largest. Decide what the read actually predicts, then choose the contract that asks that question.
Before comparing a projection with the board, confirm the listed pitcher and settlement terms. Then separate expected starter innings, starter run rate, bullpen handoff, lineup matchup, and park treatment. The MLB picks board can frame the listed markets, while the model leaderboards provide related model context. The discipline remains the same: price the chain, not the name.
Average NFL total points by recorded weather bucket
Average combined score is grouped only from completed NFL schedule rows with a recorded indoor roof state or numeric wind value.
NFL ATS cover-margin distribution
Bars count completed NFL schedule rows by closing-spread cover margin using the repository canonical home-margin grading convention.