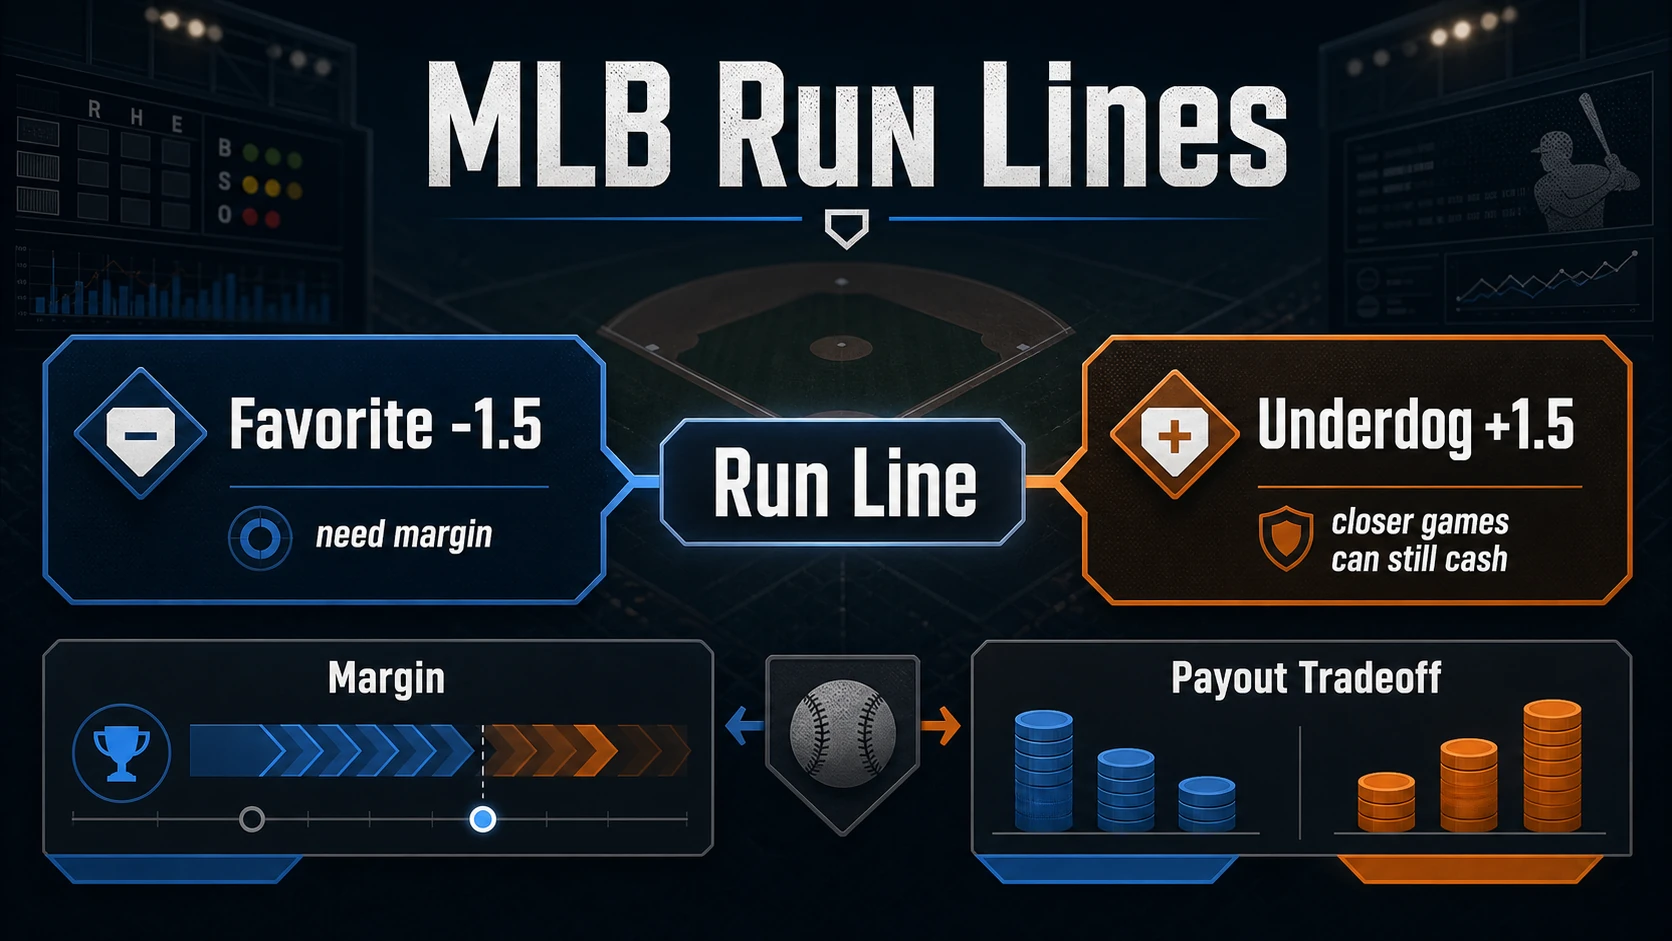
An MLB moneyline prices the chance to win; a run line prices the chance to win by a stated margin at its attached odds. That difference makes margin distribution, not just win probability, the core of the bet.
The fixed margin changes the problem
The standard run line gives the favorite minus one and a half runs and the underdog plus one and a half. The favorite side needs a win by at least two runs. A one-run favorite win cashes the moneyline and loses the run line. The underdog side can lose the game by one run and still cover.
Because the common margin stays fixed, the odds carry most of the market movement. A more dominant projection can shorten the favorite’s run-line price, while a tighter expected game can make the underdog cushion more expensive. Translate those odds into break-even probability before deciding that one side is “safer.”
The betting-odds guide covers that translation. The cushion has no standalone value without the price attached.
Moneyline probability is not margin probability
A model can like a team to win while disliking its chance to win by multiple runs. The moneyline distribution stops at who finishes ahead. The run-line distribution needs the size of the final margin.
Build that margin distribution from the same game states that produce scoring: starting pitchers, bullpen availability, lineup quality, park, weather, defense, and expected plate appearances. Then account for baseball’s asymmetric ending. A home team that leads after the top of the final inning does not bat again, removing an opportunity to extend the margin.
Do not estimate run-line probability by multiplying the moneyline probability by a universal factor. The relationship changes with the matchup and scoring environment.
Starter and bullpen views can point in different directions
A dominant starter can create a strong early lead probability while a thin bullpen leaves the full-game margin uncertain. A weaker starter backed by rested relief can produce the opposite shape. The run line prices the whole path unless the ticket is explicitly an early-segment market.
That is why the comparison with the first-five market is useful. When the model’s case is concentrated on the starters, the shorter contract fits that case; when later relief drives the read, the full-game run line is the relevant market.
The answer is not to prefer one product by habit. It is to match the market window to the evidence.
Totals provide context, not a shortcut
A wider scoring distribution can create more paths to multi-run margins, but the posted total does not tell you which team owns those paths. Team-specific scoring, bullpen asymmetry, and game-state strategy still matter.
Use the total as one input to the margin model, not as a rule that automatically selects the favorite or underdog. The same total can arise from balanced offenses, one elite lineup, poor pitching on both sides, or weather uncertainty. Those states do not produce identical run-line probabilities.
A model in Studio should predict the final margin directly or derive it from a coherent score distribution. A binary win model is not enough.
The registered chart above sums RBI by inning for the late-inning filter in the MLB Statcast 2024 dataset. It shows recorded run production in that sample. It does not identify the favorite, price, final margin, or cover result, so it cannot support a run-line performance claim.
Price the exact side you can execute
Compare the model’s margin probability with the offered run-line price after market margin. If the price moves, recompute. If a book offers an alternate margin, treat it as a new contract rather than sliding the old probability along a ladder without recalculation.
Record the accepted line, odds, timestamp, and settlement rules. A screenshot of the board after the move is not the execution price. A graded ATS record should show wins, losses, win rate, exact window, and graded sample size, with pushes and voids disclosed separately.
Selections on the MLB picks board should be evaluated under that same contract discipline. A green favorite label does not answer how often the team wins by the required margin.
Common run-line mistakes are category mistakes
“Saving juice” mistakes the run line for a discounted moneyline, while “buying insurance” assigns value to the underdog cushion without its price. “High total means favorite cover” also fails because scoring is not split evenly between teams. Each shortcut ignores the margin distribution.
The fix is a full distribution. Estimate the chance of each relevant final margin, compare it with each executable price, and preserve the uncertainty. When the model can only answer who wins, bet that question or pass.
The case should fit in one sentence
A defensible run-line bet explains why this matchup reaches the required margin at a rate that beats this price. It names the pitchers, bullpen state, lineup, environment, and market rule that drive the distribution.
Anything vaguer is a moneyline opinion wearing a spread. The run line deserves its own model because the extra run is not bookkeeping; it is the entire bet.
NFL ATS cover-margin distribution
Bars count completed NFL schedule rows by closing-spread cover margin using the repository canonical home-margin grading convention.